How to Use the Dashboard
Instructions below describe general behavior on desktop devices. Mobile devices and touch screens may use different or additional actions and gestures. Data Dashboard web site is also best viewed in: Chrome, Edge and Firefox.
Watch Video: Applying Data Filters
When a dashboard graphs page first loads, the complete dataset is presented. To narrow the view/result, you can apply data filters in one of several ways:
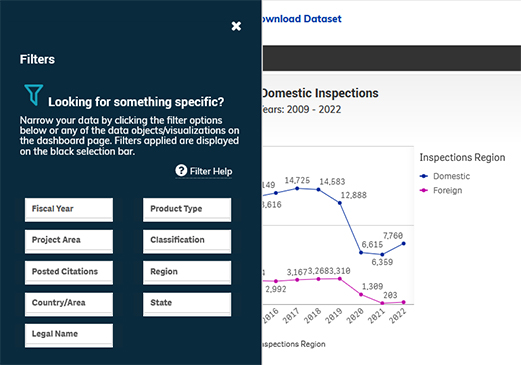
- By clicking on the Filters button.

The flyout Filters panel will open from the left side of the window. Once selections are completed, click the X in the top right corner to close the panel.
- By making selections in the filter panes.
- Click on pane to open drop-down.
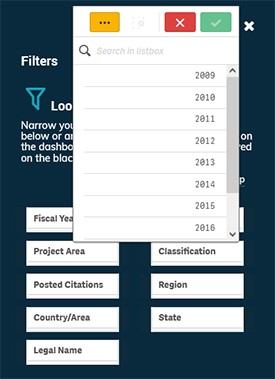
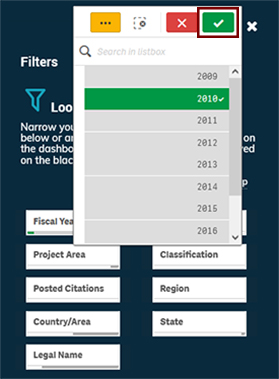
- Click on one or more values to select/unselect.
- Or enter search text then click to select values.
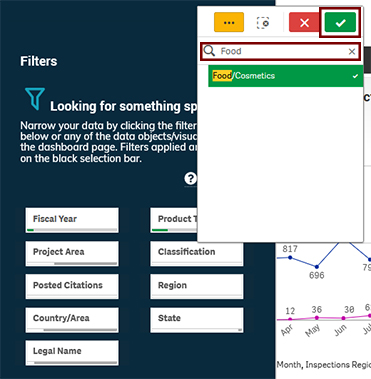
- Be sure to click the green check mark to confirm your selection. Active selections will be listed on the selection bar.

- Click on pane to open drop-down.
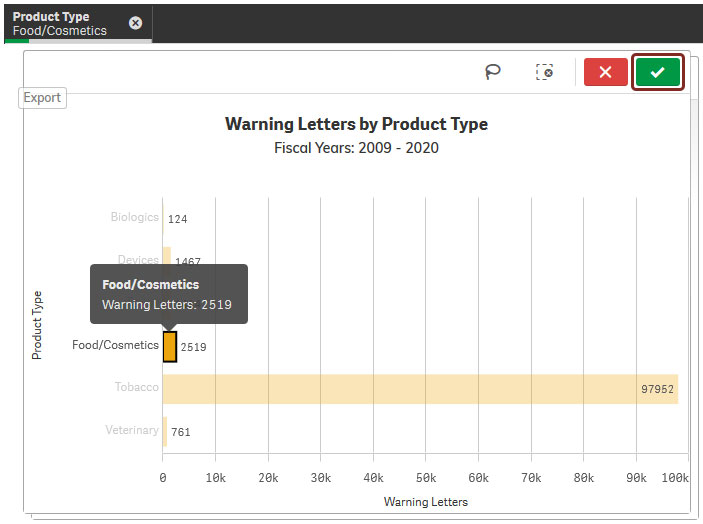
- By clicking on one or more categorical group labels on an axis or edge of a graph. Confirm with the green check mark.
- Multiple items may be selected by clicking on each one. Ctrl or Shift keys are not needed. Confirm with the green check mark.
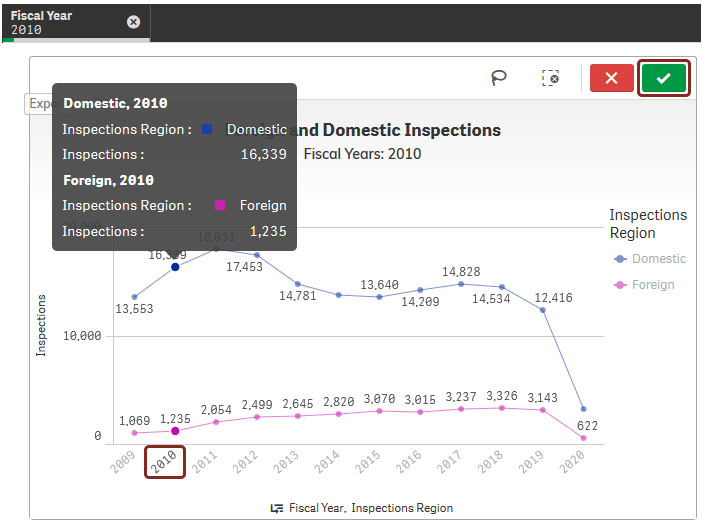
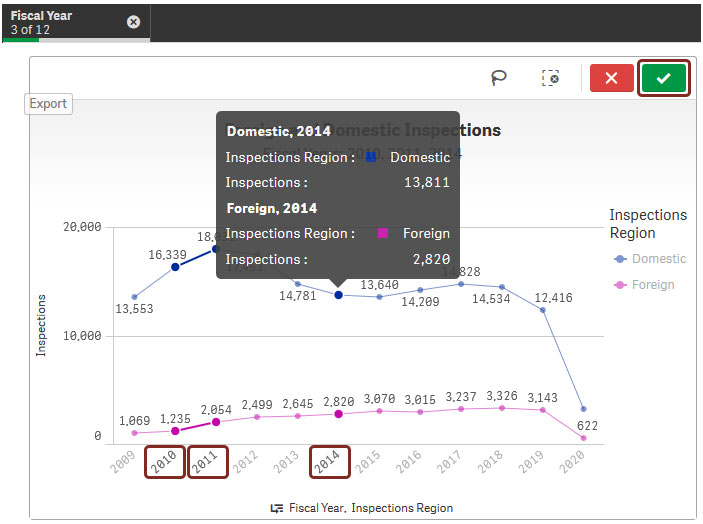
- Select and confirm one Fiscal Year to drill down to Month view. Return to Fiscal Year view by clearing the Fiscal Year in the selection bar OR by clicking Fiscal Year in the axis title.
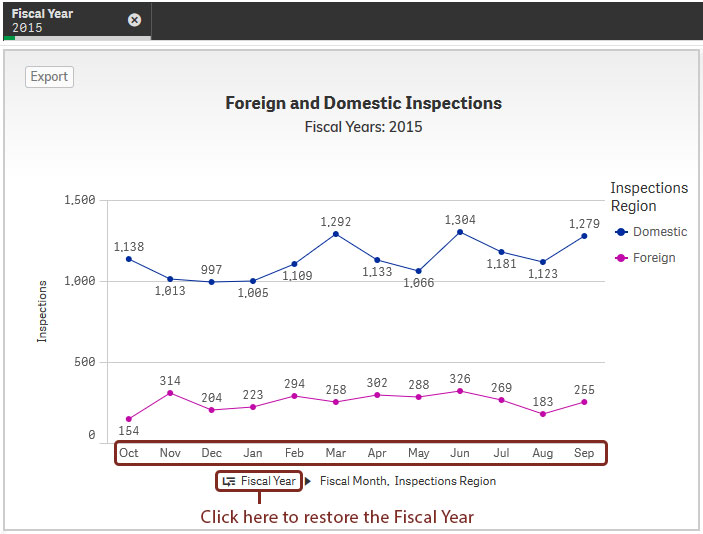
- Multiple items may be selected by clicking on each one. Ctrl or Shift keys are not needed. Confirm with the green check mark.
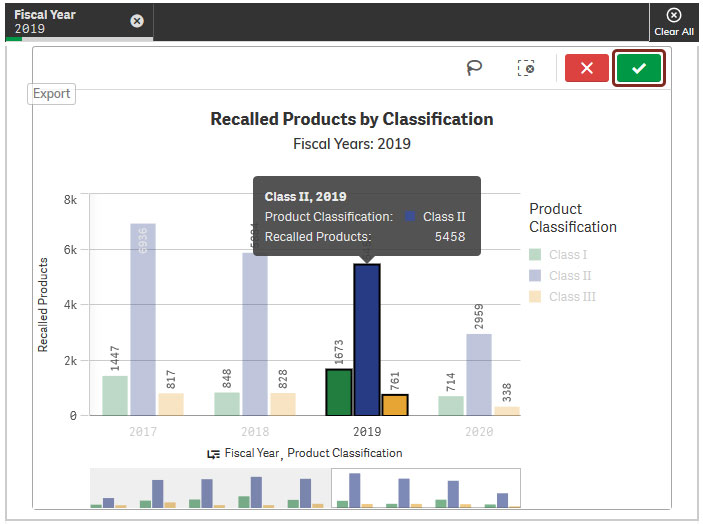
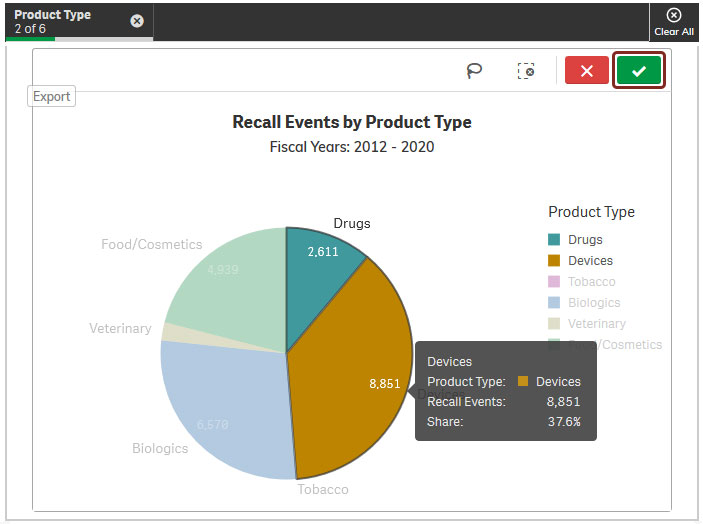
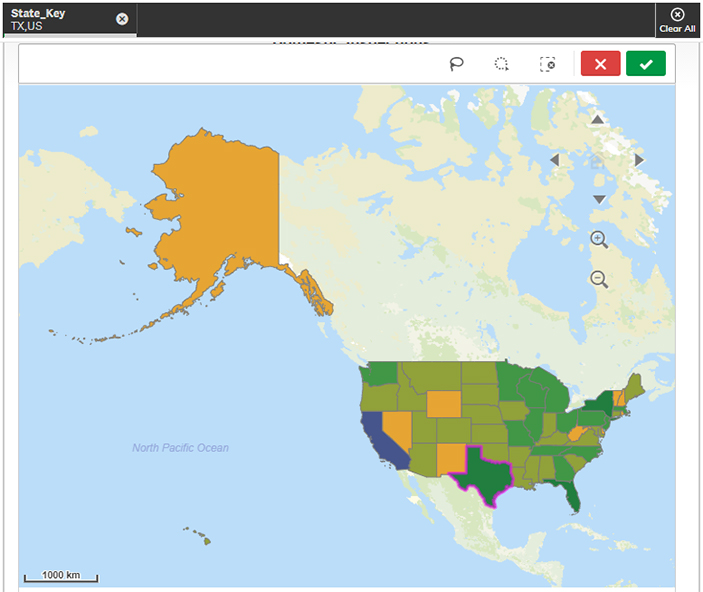
- By clicking on the graphs themselves. Confirm with the green check mark.
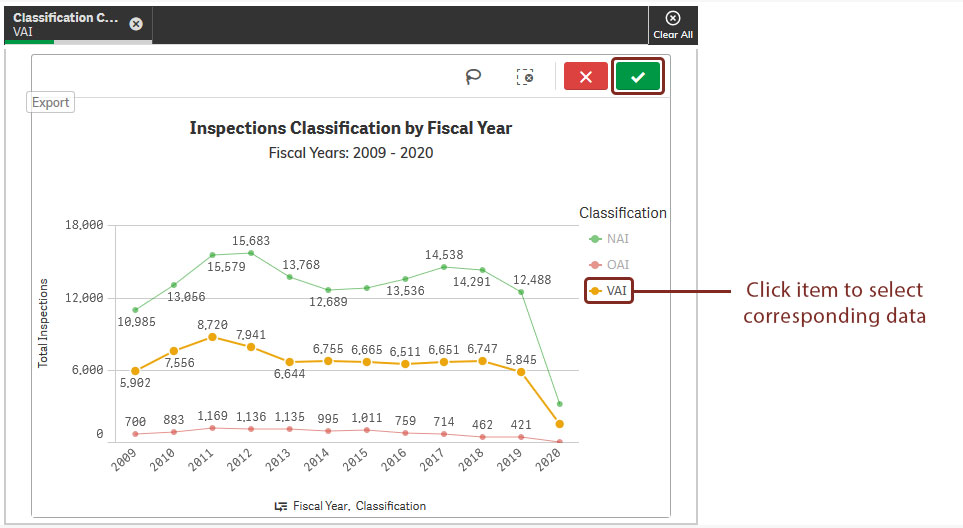
- By clicking on the legend. Confirm with the green check mark.
Watch Video: Using Maps Zoom/Pan
The following are features for zooming in and out of a map and for selecting objects on the map.
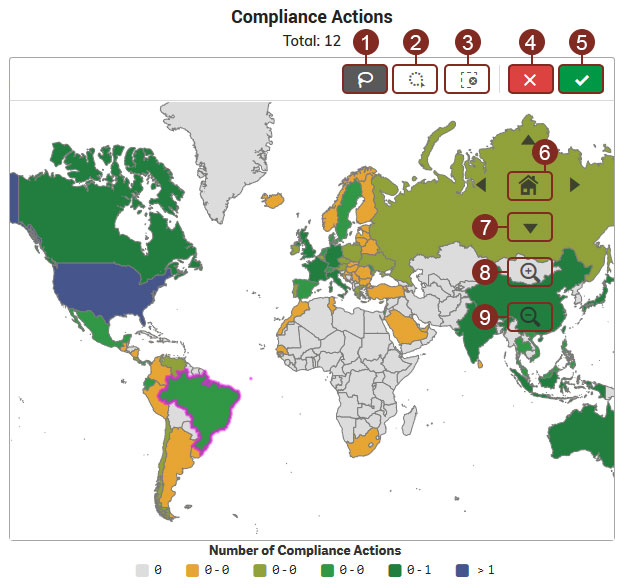
| Legend | |||
|---|---|---|---|
| Label | Tool Image | Tool Name | Action |
 |  | Lasso Selection | Draw an area to select |
 |  | Circle Selection | Drag out from center point of circle to select within distance radius |
 |  | Clear Selection | Clear a selection already made |
 |  | Cancel Selection | Cancel selection in progress |
 |  | Confirm Selection | Commit/Proceed with the selection |
 |  | Home | Reset |
 |  | Pan Direction | Pan in the selected direction |
 |  | Zoom In Tool | Zoom into a location on the map |
 |  | Zoom Out Tool | Zoom out from a location on the map |
| No Label |  | Mouse Wheel (Scroll Up) Mouse Wheel (Scroll Down) | Zoom in Zoom out |
Watch Video: Performing Data Searches
The instructions that follow are specific to the graphs pages throughout the site and not applicable to the Imports Entry Data Search page, which has standard search features that do not require special instructions.
Free-text search can be performed by typing into the search box. Results matching the search criteria can then be selected and applied to the dataset.

Watch Video: Using Data Tables
The instructions that follow are specific to the data tables on the graphs pages and not applicable to the data table on the Imports Entry Data Search page.
Data tables have many features, including search, sort, filter, data export, and more. See details below on each feature available for use.
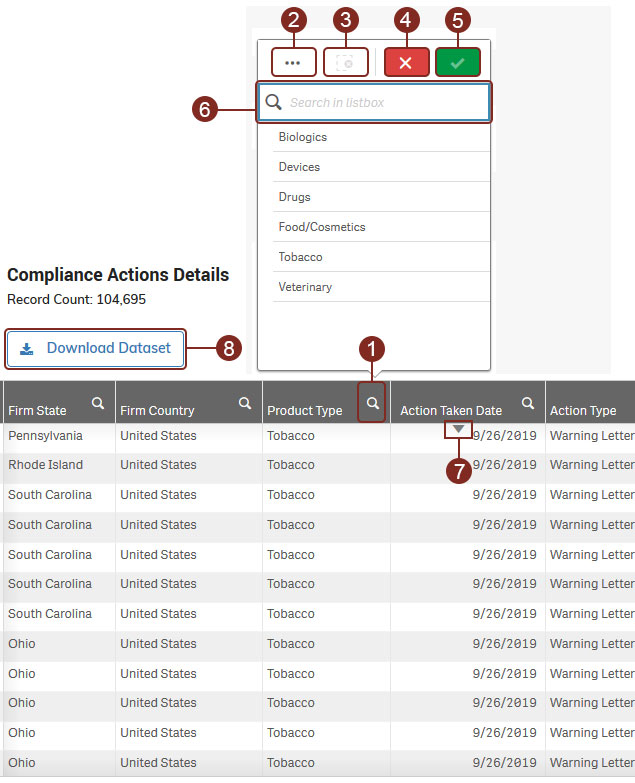
| Legend | |||
|---|---|---|---|
| Label | Tool Image | Tool Name | Action |
 |  | Magnifying Glass | Initiate a search |
 |  | Selection Menu | Filter all or possible matches |
 |  | Clear Selection | Clear a selection already made |
 |  | Cancel Selection | Cancel selection in progress |
 |  | Confirm Selection | Commit/Proceed with the selection |
 |  | Search Box | Input search keywords |
 | Sorting Icon | Sort in ascending/descending order* | |
 |  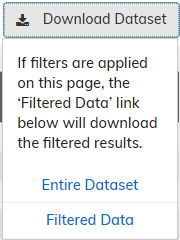  | Download Dataset | Download data in Excel format. Button and dropdown appearance vary depending on the dashboard page and whether filters are applied.
|
| *Select a column header to show the sorting icon. | |||